Debugging
Debugger Hardware Setup (nRF54L15 DK)
The recommended debugger is the Nordic nRF54L15 DK (~$35), connected via a 10-pin 1.27mm SWD cable.
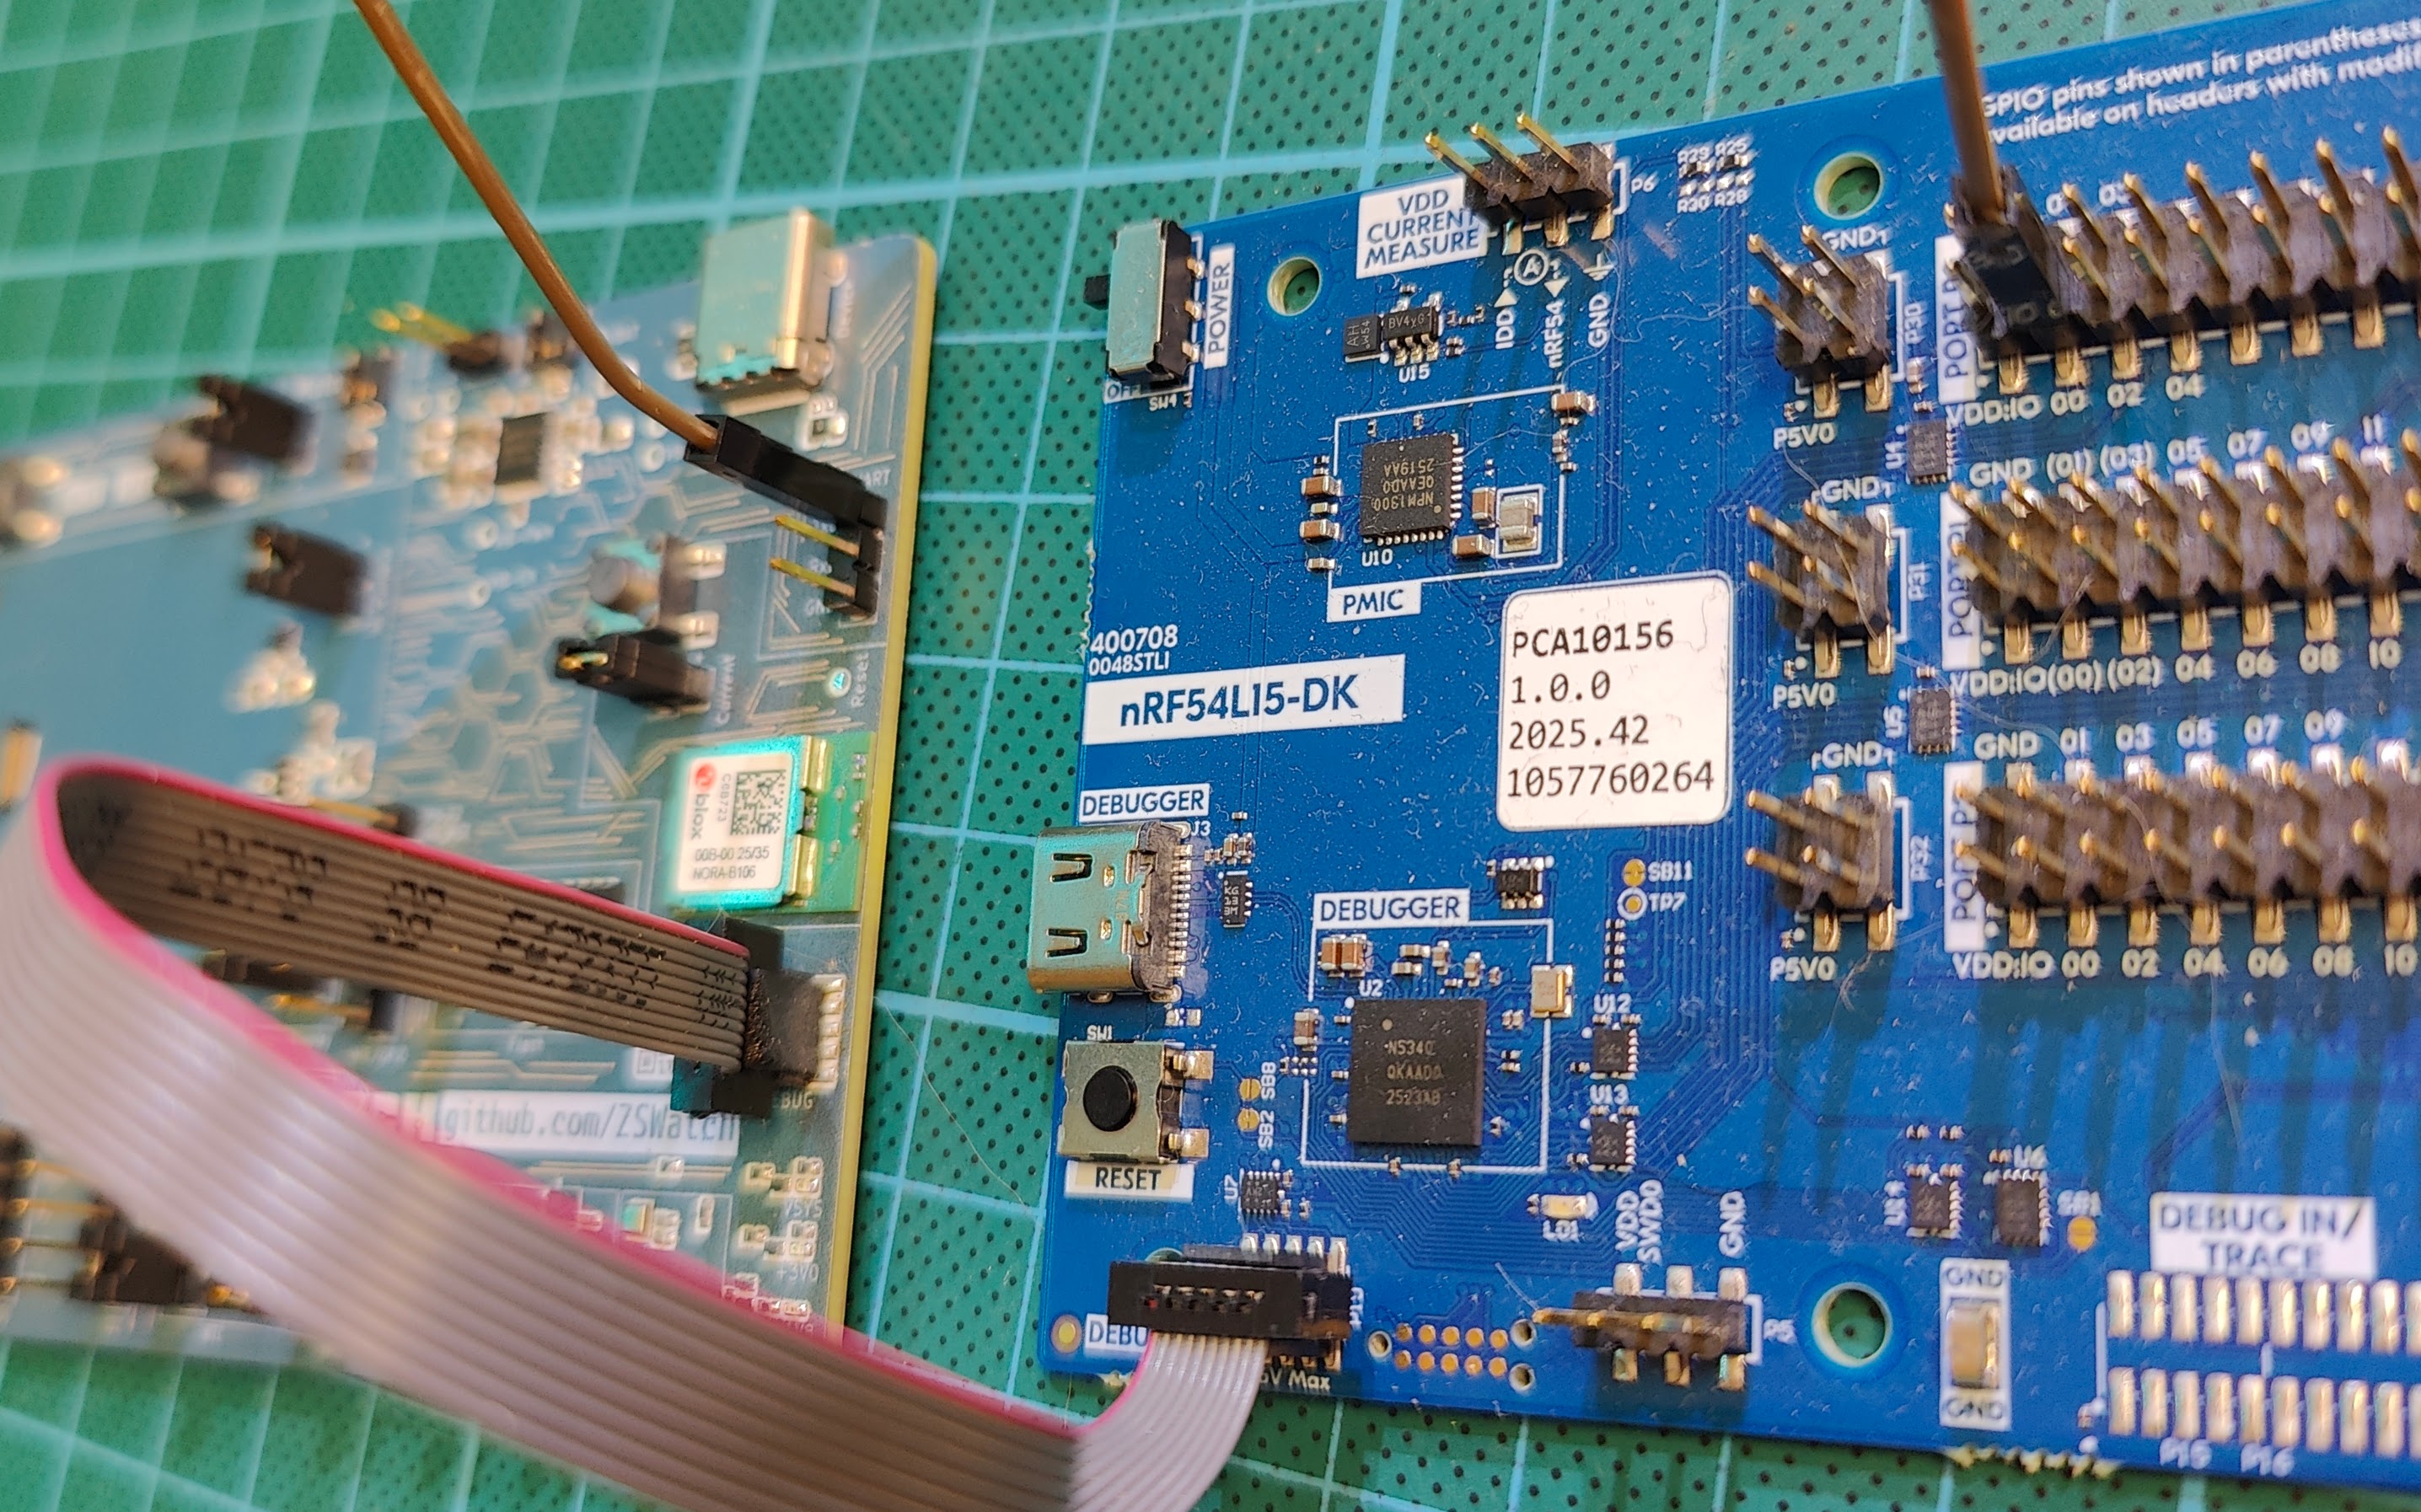
SWD cable and UART debug pin connection between the WatchDK and the nRF54L15 DK.
- SWD cable: Connect the 10-pin cable between the nRF54L15DK's Debug Out connector and the WatchDK's SWD header.
- UART logs: Connect the WatchDK's UART TxD pin to P0.00 on the nRF54L15 DK. This routes log output to VCOM0 on the nRF54L15 DK. All pre-built firmwares use UART logging, open a serial terminal on VCOM0 at 115200 baud.
- GND: If no SWD cable is connected, also connect a GND wire between the two boards.
If you don't have a debugger or serial adapter, compile the firmware with RTT enabled and view logs over the SWD connection instead. See Compiling the Software for build options.
On-Target Debugging (WatchDK / ZSWatch)
On-target debugging is handled through the nRF Connect VS Code extension, which provides GDB integration with the J-Link debugger.
Prerequisites
- A debugger connected via the 10-pin 1.27mm SWD cable (J-Link or nRF54L15 DK)
- A build configuration created in VS Code (see Compiling the Software)
Start Debugging
- In VS Code, open the nRF Connect sidebar.
- Under your build configuration, click Actions → Debug.
- Use standard VS Code debugging controls: breakpoints, step over/into, variable inspection, call stack, etc.
Reading Logs
Depending on your build configuration, logs are available through different transports:
| Transport | How to read |
|---|---|
| UART | Connect to the serial port (e.g. /dev/ttyUSB0 on Linux) at 115200 baud. Use minicom -b 115200 -D /dev/ttyUSB0 or screen /dev/ttyUSB0 115200. |
| RTT | Use SEGGER RTT Viewer or JLinkRTTLogger while the J-Link is connected. The nRF Connect extension also supports RTT output. |
| USB | Connect via USB and open the CDC ACM serial port that appears. |
See the Compiling page for how to select a log transport in your build.
Resetting the Watch
Use nRF Connect VSCode plugin -> CONNECTED DEVICES -> Reset button
OR:
nrfjprog --reset
Native Simulator Debugging (Linux)
The native simulator compiles ZSWatch as a Linux executable, allowing you to debug with standard GDB, with full variable inspection, breakpoints, and LVGL UI interaction in a simulated display window.
For full setup instructions, see the Native Simulator page.
Quick Start
- Build for
native_sim/native/64(see Native Simulator - Build). - In VS Code, go to Run and Debug (
Ctrl+Shift+D). - Select Debug Native (with sudo) and press F5.
- A simulated display window will open. Debug logs appear in the VS Code terminal.
The native simulator is the fastest way to iterate on UI and application logic. No hardware or flash cycle needed.
Coredump Debugging
ZSWatch has a built-in coredump system that captures crash information (registers, stack) when a fatal error or assertion occurs. The coredump is stored in retained RAM, then written to the filesystem (/lvgl_lfs/coredump.txt) on the next boot.
Viewing a Coredump on the Watch
- After a crash, the watch will reboot automatically.
- Open the Info app on the watch.
- If a coredump was captured, it will show the crash summary (file name, line number, timestamp).
- From the Info app, you can dump the coredump to the log output, this prints the coredump data to whatever log transport you have configured (UART, RTT, or USB).
Analyzing a Coredump
Run west coredump from the nRF Connect shell (e.g. via the nRF Connect VS Code extension terminal), where the required Python dependencies are installed.
-
Start
west coredumpand let it wait for the coredump data. Use--build_dirto let west find the ELF and toolchain automatically.Via UART:
west coredump --build_dir app/build_dbg_dk --serial_port /dev/ttyUSB0Via RTT (requires debugger connected):
west coredump --build_dir app/build_dbg_dkOr specify the ELF and toolchain manually with
--elfand--toolchaininstead of--build_dir. -
On the watch, open the Info app, then press the download button to output the coredump to the log.
west coredumpautomatically captures it and loads the crash state into GDB. -
You can now inspect variables, stack frames, and memory at the time of the crash.
The .elf file must match the exact firmware build that was running when the crash occurred. If you rebuild, the addresses won't match and the backtrace will be wrong.
If you are running a pre-built firmware (downloaded from GitHub Releases or CI), the matching .elf file is included inside the downloaded firmware .zip archive.
Erasing a Stored Coredump
From the Zephyr shell (if enabled):
zsw coredump_erase 0
Or the coredump can be erased from the Info app on the watch.